0of21read0 XP
Monitor functioning of data collection, experiments, and other software processes.
Evaluate the health and performance of data collection pipelines in production environments by selecting appropriate metrics and thresholds that detect deviations from expected behavior.[^1][^2]
- Time
- 20–25 min
- Type
- exercise
- Bloom
- Apply → Create
- XP
- 100
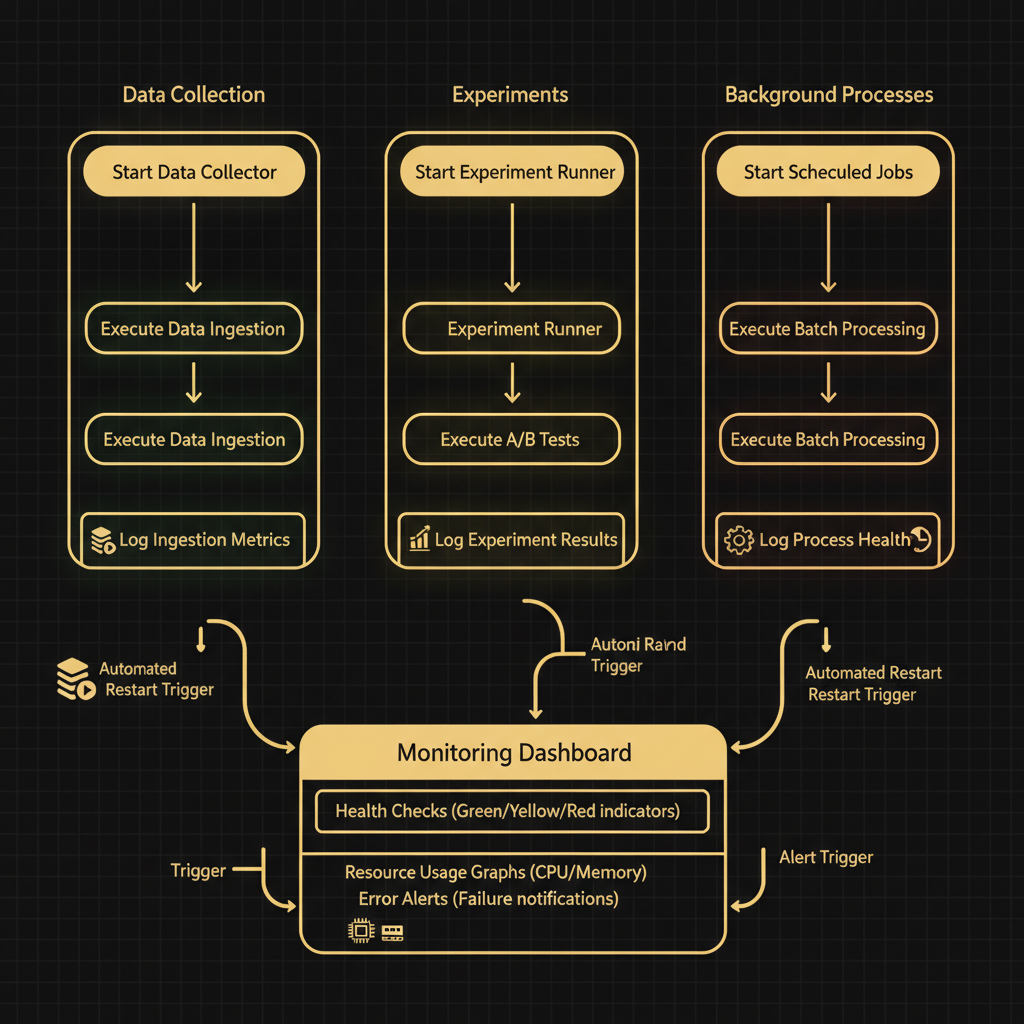
Architecture diagram for Monitor functioning of data collection, experiments, and other software processes.. The monitoring workflow for software processes in three parallel swim lanes labeled "Data Collection," "Experiments," and "Background Processes." Each lane contains process boxes (start, execute, log metrics) connected by arrows flowing downward. All three lanes feed into a central "Monitoring Dashboard" component that displays health checks, resource usage graphs, and error alerts. Include a feedback loop from the dashboard back to each process lane showing automated restart or alert triggers. Use green for healthy states, yellow for warnings, and red for failures. Add small icons for CPU meters, memory gauges, and log files at key monitoring points to indicate what metrics are tracked at each stage.
You'll be able to
- Evaluate the health and performance of data collection pipelines in production environments by selecting appropriate metrics and thresholds that detect deviations from expected behavior.[^1][^2]
- Apply systematic tracking and comparison techniques to machine learning experiments, organizing training runs and identifying which configurations lead to optimal outcomes.[^1][^2]
- Diagnose failures and anomalies in software processes supporting generative AI workflows by analyzing logs, trace data, and system telemetry to determine root causes.[^1][^2]
- Design alerting and notification strategies that balance sensitivity and specificity, ensuring that critical issues in data collection or experimental processes trigger timely human review.[^1][^2]
- Create documentation and reporting artifacts that communicate the status, performance trends, and identified issues of monitored processes to technical and non-technical stakeholders.[^1][^2]
Key concepts · tap to reveal
1/21·Idea
0%
Idea
01 / 21
The Silent Failure Problem
You're three hours into a fine-tuning run when your terminal goes silent. The loss curve flatlined 90 minutes ago, but you only notice now. When you scroll back, you discover the data loader threw a silent exception at epoch 12, and your GPU has been idle ever since, burning cloud budget on nothing. Without active monitoring, even well-architected pipelines can fail quietly. By the time you notice, you've lost hours of compute time and days of project momentum.
Your task Write a prompt that asks Claude to recommend the right AI setup for a real task you're facing — then weigh its answer against this lesson, "Monitor functioning of data collection, experiments, and other software processes.."
a strong prompt:role · context · task · format · example
Exercise · scenario
## Scenario **[Applied]** You are deploying a fine-tuning pipeline for a generative AI model on NVIDIA infrastructure. The training script logs loss metrics to a local file every 100 steps, but you notice the dashboard has shown no updates for the past 90 minutes. The job status API reports "running," GPU utilization appears normal at 92%, and no error messages have surfaced in the container logs. However, the expected checkpoint file for epoch 3 is missing from the output directory, and the last recorded validation loss is from epoch 1. You must decide whether to let the job continue, restart it immediately, or investigate further before taking action. **What would you do, and why?**
Deliverable
At the conclusion of this lesson, you will produce a **Monitoring Playbook** as a Markdown document that specifies your approach to tracking data collection, experiment execution, and software process health in a production generative AI system [^1][^2]. The playbook must define at least three distinct monitoring strategies (such as data drift detection, experiment tracking via MLFlow, or model behavior alerts), identify the tools or services you will use for each strategy, and document the success criteria and alert thresholds that trigger human review [^4].
Practice · Scenarios
0 of 8 revealed
Scenario 1 of 8
A financial services firm is collecting customer service chat transcripts to build a training dataset for a conversational AI assistant. The data collection process runs nightly, extracting anonymized conversations from the previous day. Over the past week, the ML operations engineer notices the collection job's runtime has increased from 45 minutes to 6.5 hours. The volume of collected records has grown from 12,000 to 14,000 per day (17% increase). Memory usage on the collection server has climbed from 8GB to 28GB out of 32GB available. The job logs show increasing frequency of garbage collection events and occasional 'out of memory' warnings that resolve after brief pauses.
Sources
- [1]NVIDIA-Certified Associate: Generative AI LLMs (NCA-GENL) Study Guide·NVIDIA-Certified Associate: Generative AI LLMs (NCA-GENL) Study Guide (2026) · Vendor
- [2]NVIDIA-Certified Associate: Generative AI Multimodal (NCA-GENM) Study Guide·NVIDIA-Certified Associate: Generative AI Multimodal (NCA-GENM) Study Guide (2026) · Vendor
- [3]AWS Well-Architected Framework: Machine Learning Lens·AWS Well-Architected Framework: Machine Learning Lens (2026) · Vendor
- [4]OpenAlex API·OpenAlex API (2026) · Research
Submit your work for review
Paste your capstone artifact below. You'll get back a 4-level rubric grade, per-criterion feedback, and three concrete edits to strengthen it.