0of19read0 XP
Compare models using statistical performance metrics, such as loss functions or proportion of explained variance.
Evaluate multiple candidate models by calculating and interpreting statistical performance metrics, including loss functions and proportion of explained variance, in alignment with the NCA-GENL exam task [^1][^2].
- Time
- 20–25 min
- Type
- exercise
- Bloom
- Apply → Create
- XP
- 100
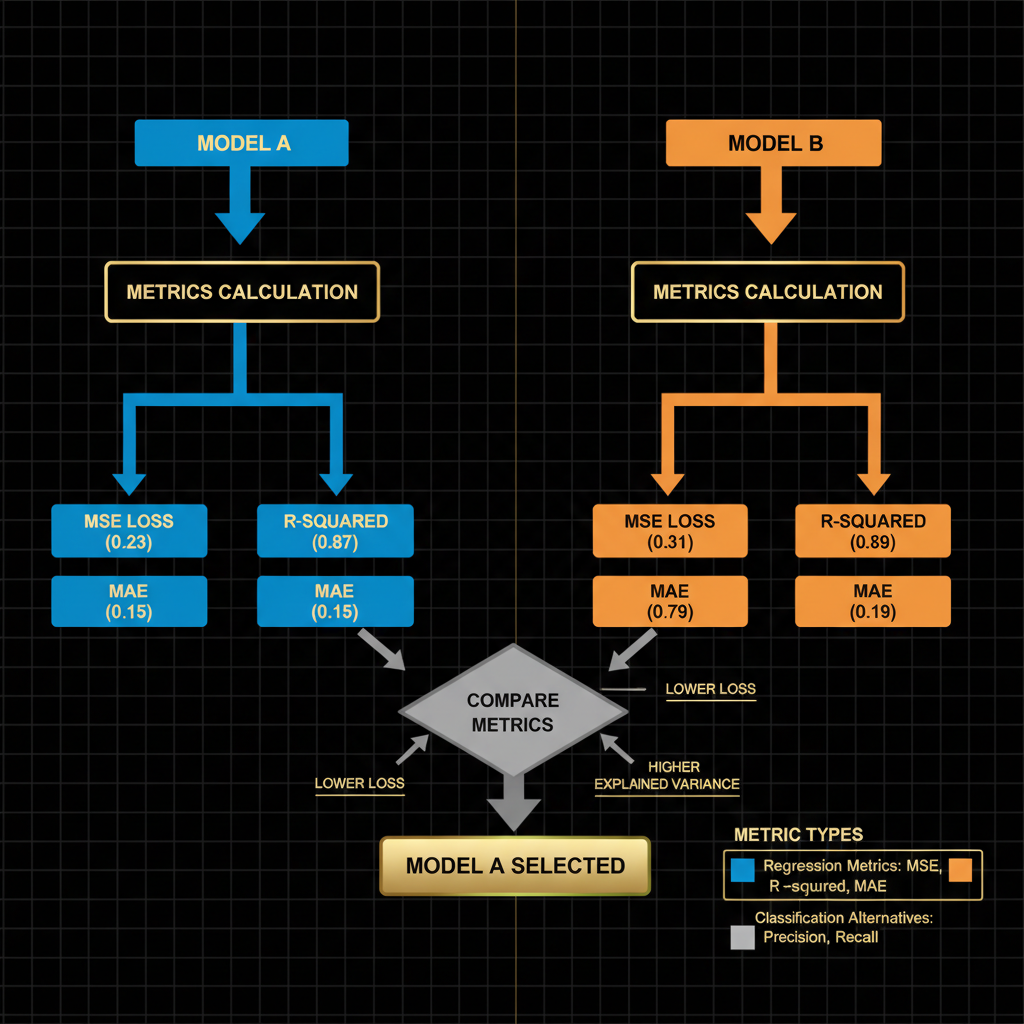
Architecture diagram for Compare models using statistical performance metrics, such as loss functions or proportion of explained variance.. Create a side-by-side comparison flowchart showing two parallel model evaluation pipelines. On the left, display Model A feeding into a metrics calculation box that outputs three key statistics: MSE loss (0.23), R-squared (0.87), and MAE (0.15). On the right, show Model B with identical structure but different values: MSE loss (0.31), R-squared (0.79), and MAE (0.19). Below both pipelines, include a decision diamond labeled "Compare Metrics" that points to a green-highlighted box stating "Model A Selected" with arrows indicating lower loss and higher explained variance as selection criteria. Use blue for Model A pathway, orange for Model B pathway, and neutral gray for the comparison logic. Label axes and include a legend distinguishing regression metrics from classification alternatives.
You'll be able to
- Evaluate multiple candidate models by calculating and interpreting statistical performance metrics, including loss functions and proportion of explained variance, in alignment with the NCA-GENL exam task [^1][^2].
- Apply appropriate loss functions to specific generative AI model training scenarios, justifying your selection based on task requirements such as classification, regression, or knowledge graph embedding contexts [^3][^6][^7].
- Compare the training outcomes of two or more models by analyzing their loss function behavior over time, identifying which model better fits the data and explaining the trade-offs between different performance metrics [^7].
- Classify performance metrics as appropriate or inappropriate for a given model comparison task, distinguishing between metrics suited for quality assessment, diversity measurement, and alignment with human preferences [^4][^5][^7].
- Create a justified recommendation for model selection by synthesizing multiple statistical performance indicators, including loss values and variance explained, to support production deployment decisions in NVIDIA-aligned workflows [^1][^2][^7].
Key concepts · tap to reveal
1/19·Idea
0%
Idea
01 / 19
Why Model Comparison Matters
You've trained three transformer models on customer-support data. All converge, produce plausible outputs, and log "training complete." Which one deploys to production? Without systematic comparison using loss functions, explained variance, or other statistical metrics, you're choosing blindly. This risks poor user experience, wasted compute, or regulatory failures when the weaker model breaks under real-world load. The difference between informed selection and costly guessing hinges on measuring performance with precision.
Your task Write a prompt that asks Claude to recommend the right AI setup for a real task you're facing — then weigh its answer against this lesson, "Compare models using statistical performance metrics, such as loss functions or proportion of explained variance.."
a strong prompt:role · context · task · format · example
Exercise · scenario
## Scenario **Difficulty Level: Applied** You are evaluating two fine-tuned language models for a customer support chatbot. Model A was trained using softmax cross-entropy loss, while Model B used a negative sampling approach. Both models achieve similar accuracy on a held-out test set (82% and 81% respectively), but your team needs to select one for production deployment. The models were trained on different **loss functions**, which may affect how they handle edge cases and rare query types[^1][^2]. Preliminary analysis shows Model A has slightly lower perplexity on common queries, while Model B appears more robust on infrequent question patterns. Your manager asks you to justify the final selection based on statistical **performance metrics** beyond simple accuracy. What would you do, and why?
Deliverable
You will produce a **Model Comparison Report** as a Markdown document that compares at least two candidate models (**regression**, **classification**, or generative) on a shared task using at least three distinct statistical **performance metrics** [^1][^2]. The report must include a table summarizing each model's loss function and performance scores, a written interpretation of which model performs better under which metric, and a one-paragraph justification of your final model selection grounded in the trade-offs between metrics [^7].
Practice · Scenarios
0 of 8 revealed
Scenario 1 of 8
An e-commerce platform is comparing three generative models for product description creation. The ML team reports the following perplexity scores on the test corpus: Model X scores 45.2, Model Y scores 38.7, and Model Z scores 52.1. All models were trained on identical datasets and use comparable architectures. The business stakeholders want to understand which model generates the most coherent and predictable text based on these metrics. The deployment timeline is tight, requiring immediate model selection.
Sources
- [1]NVIDIA-Certified Associate: Generative AI LLMs (NCA-GENL) Study Guide·NVIDIA-Certified Associate: Generative AI LLMs (NCA-GENL) Study Guide (2026) · Vendor
- [2]arXiv API·arXiv API (2026) · Research
- [3]arXiv API·arXiv API (2026) · Research
- [4]OpenAlex API·OpenAlex API (2026) · Research
- [5]arXiv API·arXiv API (2026) · Research
- [6]arXiv API·arXiv API (2026) · Research
Submit your work for review
Paste your capstone artifact below. You'll get back a 4-level rubric grade, per-criterion feedback, and three concrete edits to strengthen it.