0of20read0 XP
Compare models using statistical performance metrics, such as loss functions or proportion of explained variance.
Evaluate multiple candidate models by calculating and comparing their loss function values across training and validation datasets, selecting the model that best balances fit and generalization for a given generative AI task[^1][^2].
- Time
- 20–25 min
- Type
- exercise
- Bloom
- Apply → Create
- XP
- 100
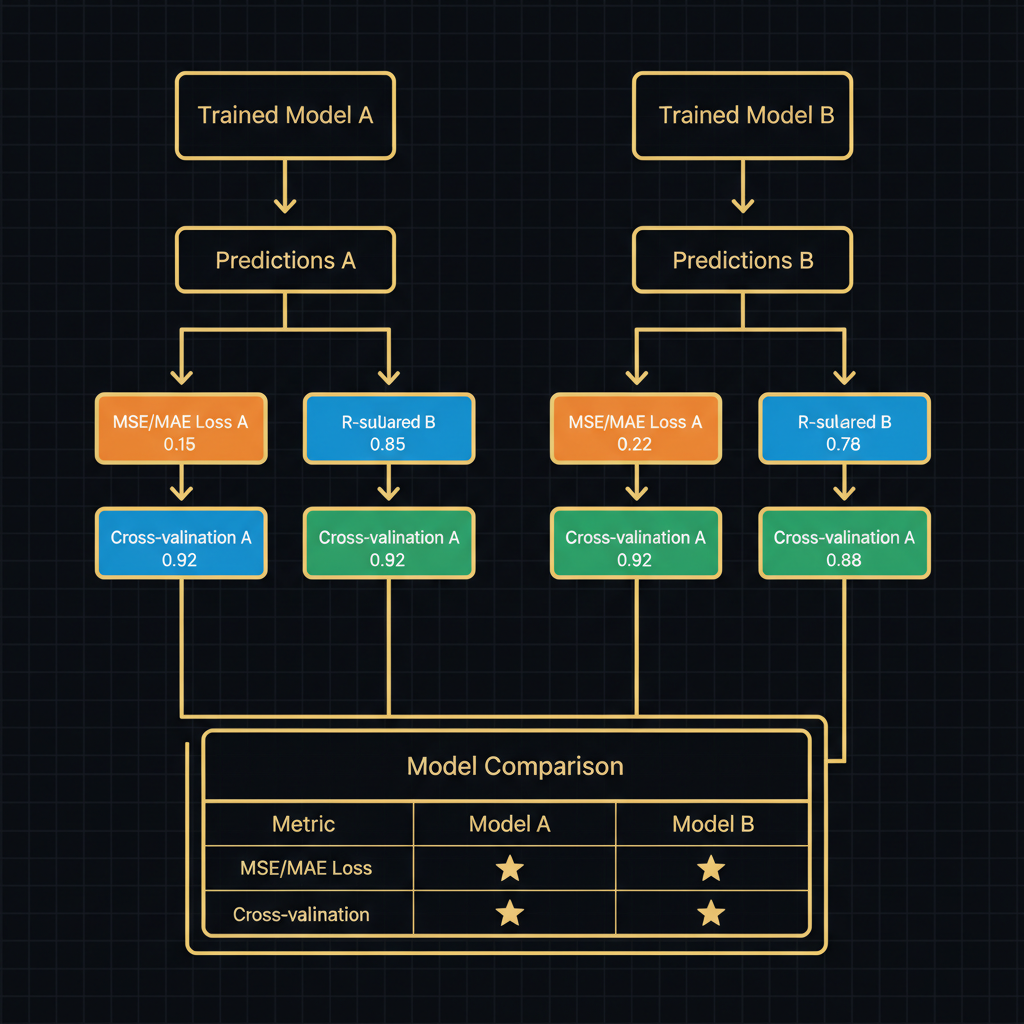
Architecture diagram for Compare models using statistical performance metrics, such as loss functions or proportion of explained variance.. Create a side-by-side comparison flowchart showing two parallel model evaluation pipelines. Each pipeline starts with a trained model box at the top, flows down through a predictions step, then branches into three metric calculation boxes: MSE/MAE loss function (orange), R-squared explained variance (blue), and cross-validation score (green). Below both pipelines, include a final comparison table box with columns for Model A and Model B, rows for each metric, with checkmark or star indicating the better performer. Use arrows to show data flow from model through metrics to comparison. Label axes and include sample numeric values (like R-squared 0.85 vs 0.78) to illustrate concrete performance differences. Style as a technical ML workflow diagram with clean rectangular nodes and directional connectors.
You'll be able to
- Evaluate multiple candidate models by calculating and comparing their loss function values across training and validation datasets, selecting the model that best balances fit and generalization for a given generative AI task[^1][^2].
- Apply proportion of explained variance and other statistical performance metrics to quantify how well competing models capture patterns in structured data, justifying model selection decisions with quantitative evidence[^1][^2].
- Classify loss functions by their suitability for specific model architectures and data characteristics, explaining how proper loss function selection mitigates model limitations and influences training outcomes[^3][^7].
- Compare model performance across diverse evaluation metrics (including quality, diversity, and task-specific measures), interpreting trade-offs between competing objectives to recommend the most appropriate model for production deployment[^4][^7].
- Create a systematic model comparison framework that pairs loss functions with evaluation metrics aligned to business requirements, documenting the rationale for metric selection based on domain constraints and empirical model behavior[^7].
Key concepts · tap to reveal
1/20·Idea
0%
Idea
01 / 20
When Accuracy Isn't Enough
Two transformer models both claim 94% accuracy on your validation set, yet their cross-entropy losses differ dramatically: 0.31 versus 0.19. The accuracy numbers match, but the loss functions reveal which model truly understands the data. Research on knowledge graph embeddings shows that loss function choice determines whether a model learns underlying patterns, even when surface metrics look identical. Before deploying based on a single performance number, you need to understand what your loss functions and variance metrics actually reveal about model behavior.
Your task Write a prompt that asks Claude to recommend the right AI setup for a real task you're facing — then weigh its answer against this lesson, "Compare models using statistical performance metrics, such as loss functions or proportion of explained variance.."
a strong prompt:role · context · task · format · example
Exercise · scenario
## Scenario **Difficulty Level: Applied** You are evaluating two fine-tuned large language models for a customer-support chatbot deployment. Model A was trained using softmax **cross-entropy loss**, while Model B used a negative sampling approach with a custom loss function. Both models achieve similar accuracy on held-out test prompts, but your team needs to justify the final selection to stakeholders who want evidence that the chosen model generalizes better and aligns with user preferences. You have access to training logs, validation perplexity curves, and the proportion of variance each model explains on a benchmark dataset of customer queries. However, you lack a unified framework to compare the two **loss functions** directly, and early experiments suggest that the loss function choice may influence how quickly each model learns preferred versus dispreferred responses[^6][^3]. **What would you do, and why?**
Deliverable
You will produce a **Model Comparison Report** as a Markdown document that compares two or more candidate models on a shared task using at least three statistical performance metrics. The report must include (1) a table showing each model's scores on **loss functions** or **proportion of explained variance**, (2) a written interpretation of which model performs best and why, supported by the metric values, and (3) inline citations to the official exam objective [^1][^2] and to at least one peer-reviewed discussion of how loss function selection affects performance [^3][^6][^7].
Practice · Scenarios
0 of 8 revealed
Scenario 1 of 8
A financial services firm is building a fraud detection system using neural networks to classify transactions as legitimate or fraudulent. Three candidate models are evaluated on a validation dataset of 100,000 transactions with 2% fraud prevalence. Model X achieves binary cross-entropy loss of 0.089, Model Y records 0.112, and Model Z shows 0.095. All models demonstrate similar precision and recall on the minority fraud class. The compliance officer requires selecting the model that best captures the underlying probability distribution of fraudulent behavior to minimize false negatives in production.
Sources
- [1]NVIDIA-Certified Associate: Generative AI LLMs (NCA-GENL) Study Guide·NVIDIA-Certified Associate: Generative AI LLMs (NCA-GENL) Study Guide (2026) · Vendor
- [2]arXiv API·arXiv API (2026) · Research
- [3]arXiv API·arXiv API (2026) · Research
- [4]OpenAlex API·OpenAlex API (2026) · Research
- [5]arXiv API·arXiv API (2026) · Research
- [6]arXiv API·arXiv API (2026) · Research
Submit your work for review
Paste your capstone artifact below. You'll get back a 4-level rubric grade, per-criterion feedback, and three concrete edits to strengthen it.